Macun Meteo Monitoring (update 17.11.2026 - 02:03)

Battery
This shows the supply voltage of the station and its data logger, and is a measure of system health rather than of the environment. The Macun station sits at 2600 m in the Swiss National Park with no mains power, so it runs on a battery kept charged by a solar panel. The voltage follows a daily and seasonal rhythm: it rises while the sun charges the battery and falls overnight and during long overcast or snow-covered periods. Cold reduces the usable capacity of the battery, so the lowest values are typically seen in mid-winter. A steady decline, or values dropping toward the cut-off threshold, is an early warning that the panel is snowed over or the battery is ageing, and that a service visit may be needed before data are lost.
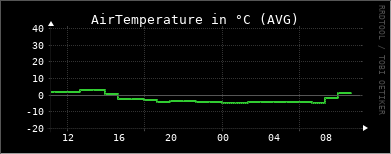
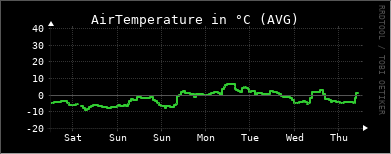
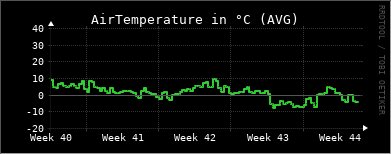
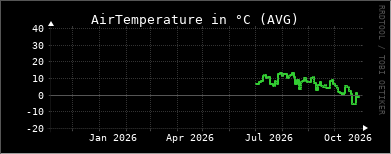
AirTemperature
Air temperature is one of the most important measures for tracking long-term change, and high-altitude sites like Macun are warming faster than the lowlands. It sets the pace of the mountain year - the start and end of the growing season, the timing of snowmelt, and the frequency of frost. At 2600 m the air is thin and clear, so temperatures swing widely between a sunlit day and a clear, radiatively cooling night. The value is measured by the ATMOS 41 weather station and, together with humidity and radiation, describes the energy available to the snowpack, soils and vegetation of the Macun basin. It is also used to correct other measurements, such as the speed of sound in the ultrasonic snow-depth reading.
Atmospheric Pressure
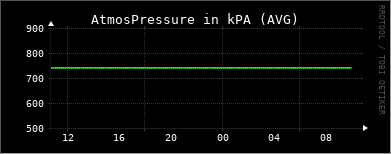
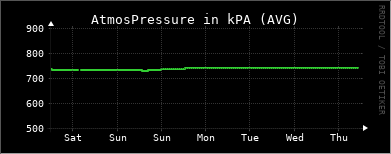
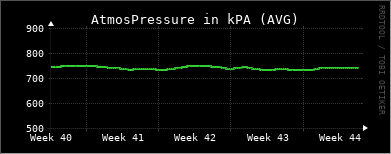
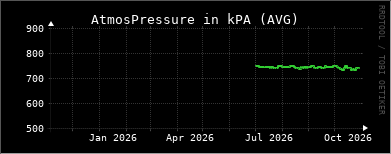
Barometric pressure is measured by the ATMOS 41 and reflects both the weather and the altitude of the site. At 2600 m roughly a quarter of the atmosphere already lies below the station, so absolute values are far lower than at valley stations - typically around 74 kPa rather than the ~101 kPa of sea level. The short-term changes are the useful signal: a falling barometer usually announces an approaching front and unsettled weather, while a rising, steady barometer indicates fair, stable conditions. In the mountains these swings can be rapid and are a good early indicator of incoming storms. Pressure is also needed to convert and quality-check several of the other weather variables.
Relative Humidity
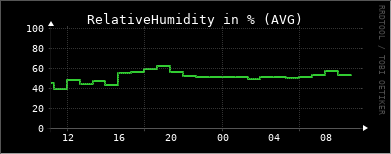
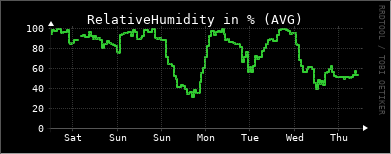
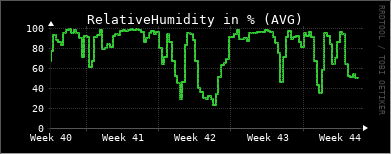
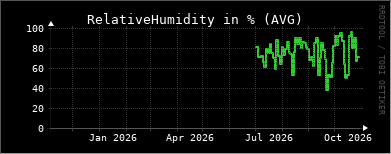
Relative humidity describes how close the air is to saturation and is measured by the ATMOS 41. At an exposed alpine site it swings between very dry air on clear, sunny days and full saturation when the station sits inside cloud or fog, which happens often at 2600 m. Humidity controls how quickly water is lost from soils, vegetation and the snowpack through evaporation and sublimation, and near saturation with sub-zero temperatures it drives riming, the feathery ice that forms on instruments and plants. Together with temperature it also indicates the risk of freezing fog and icing, which can temporarily affect the other sensors.
Precipitation
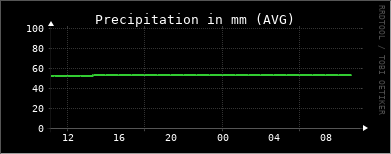
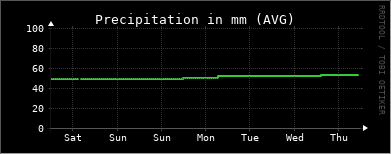
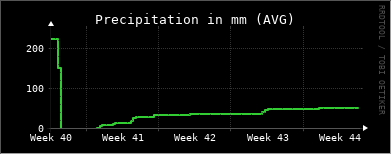
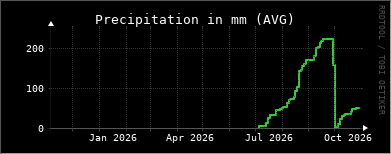
This is the precipitation recorded by the ATMOS 41's own rain gauge, which senses the impact of individual drops. It responds well to liquid rain during the warmer months, but like all gauges of this type it tends to under-catch snow, because snowflakes are light and are easily carried past the small opening by wind - and at 2600 m a large share of the yearly precipitation falls as snow. For this reason the station also carries a radar precipitation sensor (see the WS100 values), and comparing the two gives a more complete picture of how much water actually reaches the Macun basin. Precipitation is the primary input to the whole hydrological system, feeding the soils, wetlands and lakes that the water-quality station downstream then monitors.
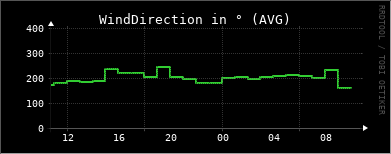
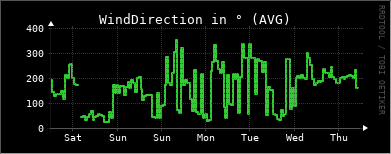
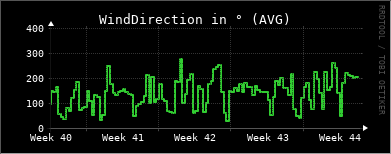
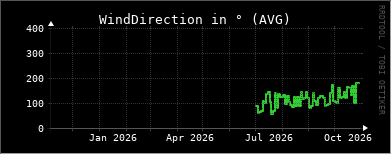
WindDirection
Wind direction is measured by the ATMOS 41's ultrasonic anemometer, which has no moving parts and so keeps working in cold and icing conditions. In a high mountain basin the wind is strongly shaped by the surrounding terrain, funnelled along ridges and valleys, and the record reveals both the prevailing weather flow and the local mountain and valley breezes that reverse between day and night. The direction of the strongest events matters ecologically because wind redistributes snow, stripping it from exposed ridges and piling it into hollows and lee slopes, which in turn controls where snow lingers into the summer.
WindSpeed
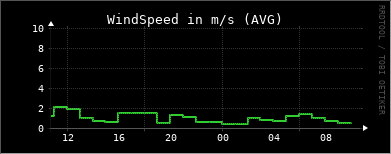
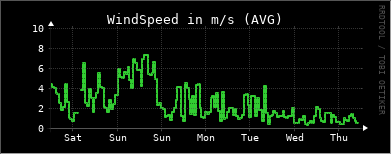
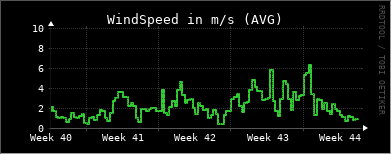
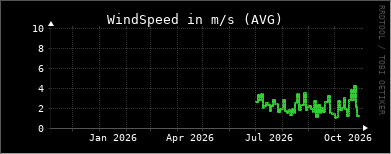
Wind speed is measured by the ATMOS 41's ultrasonic anemometer. Exposed alpine sites are among the windiest in the landscape, and wind is a major driver of the mountain environment: it increases evaporation and sublimation, cools plants and animals through wind chill, and redistributes snow across the basin. Sustained strong winds during snowfall build the drifts and cornices that shape the snowpack and can feed avalanches. Because the sensor has no cups or vanes it continues to measure in freezing conditions, although heavy riming can still affect readings until it clears.
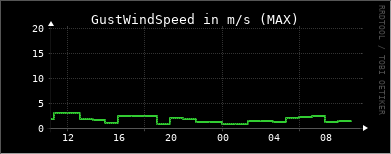
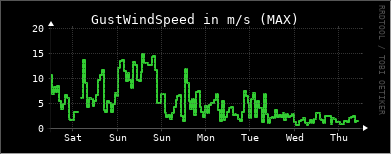
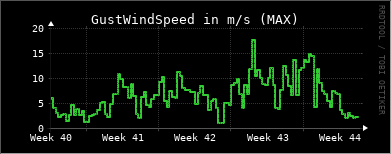
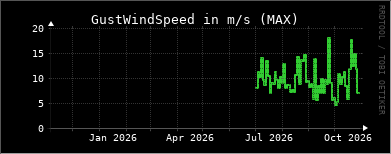
GustWindSpeed
This is the peak gust - the highest short-lived wind speed within each measurement interval - recorded by the ATMOS 41. Gusts are usually far stronger than the average wind and are what actually stress vegetation, move snow and put loads on structures and instruments. At an exposed 2600 m site the gap between the mean wind and the gusts can be large, especially during the passage of fronts and summer thunderstorms. Tracking gusts alongside the mean wind helps to identify the most extreme events and to interpret sudden changes in the snow-depth and precipitation records.
Strikes
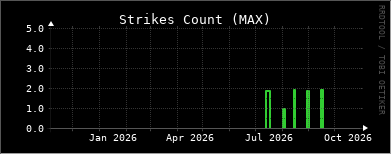
The ATMOS 41 includes a lightning sensor that counts electrical discharges detected near the station. In the Alps, thunderstorms build most often on summer afternoons, when the sun heats the slopes and drives strong upward air movement, so the strike count is a direct record of convective storm activity over the Macun area. Peaks in the count typically coincide with short, intense bursts of rain or hail and strong gusts in the other sensors.
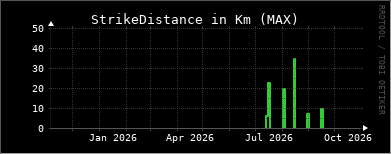
StrikeDistance
Together with the strike count, the ATMOS 41 estimates the average distance to the detected lightning. This tells you whether a storm is passing directly over the Macun basin or is still some way off, and following the distance over time shows whether a storm is approaching or moving away. Read alongside the strike count, the wind gusts and the precipitation, it helps to reconstruct the track and intensity of individual thunderstorms across this alpine catchment.
SolarRadiation
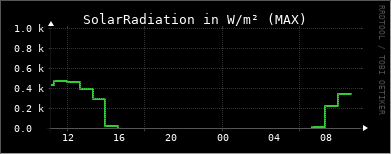
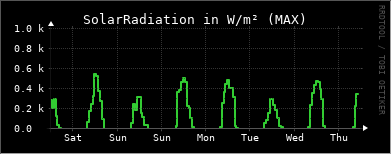
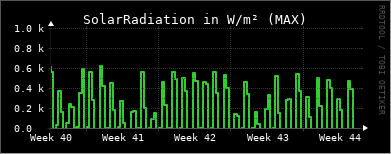
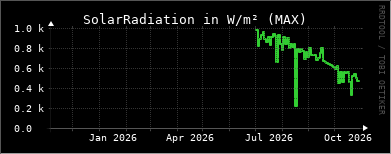
Solar radiation is the incoming shortwave energy from the sun, measured by the ATMOS 41. At 2600 m the atmosphere is thin and often very clear, so the mountain sun is intense and radiation values on a clear day are among the highest found in the landscape, along with strong ultraviolet levels. This energy is the engine of the whole system: it powers photosynthesis in the alpine plants and in the algae of the Macun lakes, and it is the main source of the heat that melts the winter snowpack in spring. Fresh snow reflects most of this radiation back to the sky, so the surface energy balance changes dramatically once the snow has gone. The same sunlight also recharges the station's solar panel and battery.
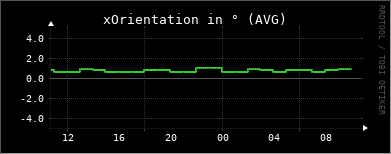
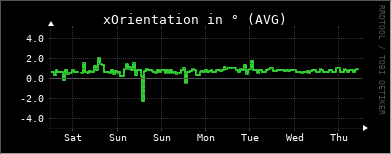
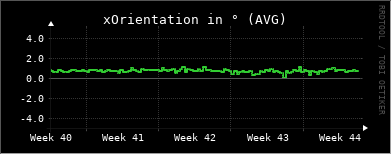
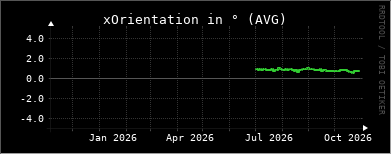
xOrientation
The ATMOS 41 contains a built-in tilt sensor that reports how far the station is leaning from vertical along its X axis, in degrees. This is a housekeeping value used to check data quality rather than an environmental measurement: several sensors - the rain gauge, the anemometer and the radiation sensor - assume that the station is standing level. At a remote alpine site the mast can slowly tilt as the ground heaves and thaws through the seasons, or shift suddenly under heavy snow load, wind or the attention of wildlife. A gradual drift or a step change in this value is a signal that the station needs to be re-levelled on the next visit.
yOrientation
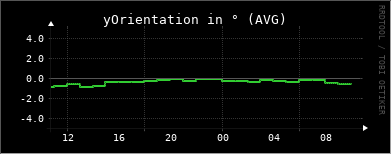
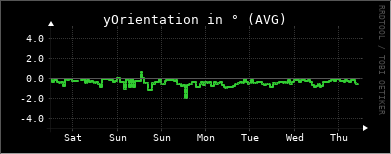
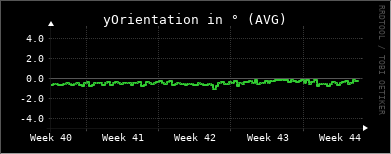
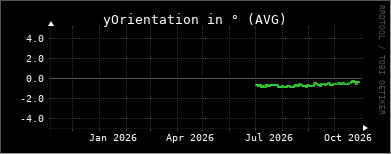
This is the companion to the X-axis reading: the ATMOS 41's tilt sensor reports the lean of the station from vertical along its Y axis, in degrees. Taken together, the two orientation values describe the exact attitude of the station and confirm whether it is standing upright. They are diagnostic values that help to interpret and correct the wind, precipitation and radiation data, and to detect when frost heave, snow load or wind has knocked the mast out of level at this exposed 2600 m site.
SnowDepth
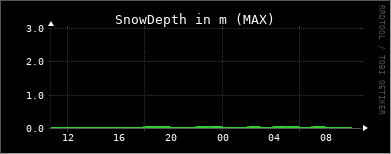
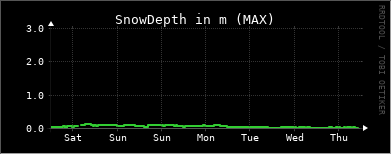
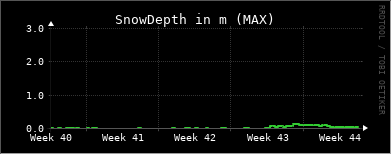
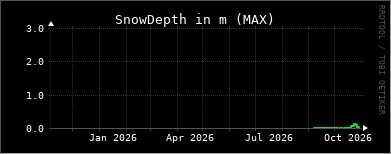
Snow depth is the headline winter measurement at Macun and is derived from the Campbell SnowVUE 10 ultrasonic sensor mounted above the ground. The sensor sends a pulse of sound downward and times its return from the snow (or bare ground) surface; the depth is the difference between the fixed mounting height and that measured distance. At 2600 m the snowpack governs almost everything: it stores the winter's precipitation as water, insulates the soil and its organisms through the cold months, and releases its meltwater in spring to feed the wetlands and lakes of the basin. The date on which the snow finally disappears sets the length of the growing season and is one of the most sensitive local indicators of a changing alpine climate.
TCDT
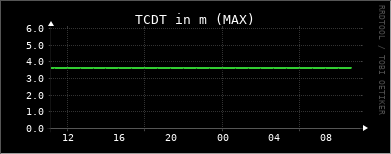
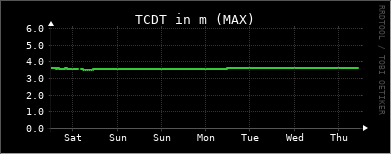
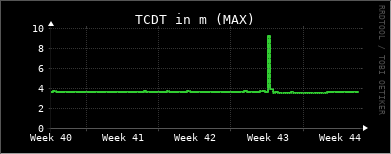
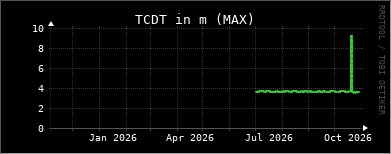
TCDT is the temperature-corrected distance from the SnowVUE 10 down to the surface below it, and it is the raw measurement from which snow depth is calculated. Because the sensor works by timing an ultrasonic pulse, and the speed of sound in air changes with temperature, the raw travel time must be corrected using a separate air-temperature measurement before it gives a true distance - that correction is what turns DT into TCDT. The reference temperature comes from an external sensor at the station [SOURCE: e.g. the ATMOS 41 air temperature / a dedicated 109 or TempVue10 probe - confirm which] rather than from the SnowVUE's own internal temperature, which serves only as a diagnostic of the instrument. Subtracting the corrected distance from the known mounting height yields the snow depth shown above. TCDT is displayed here mainly for quality control, so that the snow-depth record can be checked and traced back to the underlying measurement.
Q
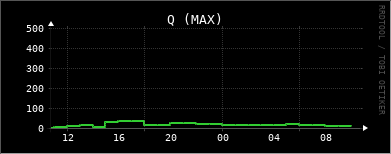
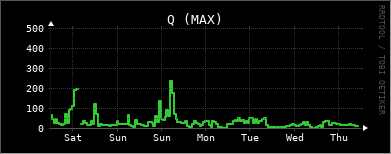
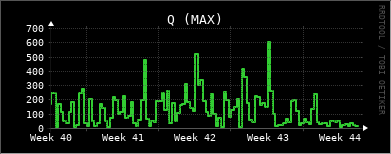
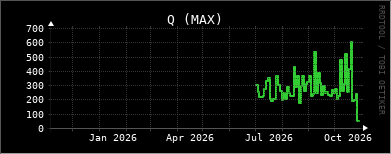
Q is a quality index that the SnowVUE 10 reports for each measurement, describing how clean and strong the returning ultrasonic echo was. A fresh, flat snow surface gives a clear, confident echo, whereas falling snow, blowing snow, fog or a very soft, fluffy new snow layer scatter the pulse and produce weaker, less certain returns. The value is used to screen the data: readings taken when the quality is poor can be flagged or discarded, so that noise and dropouts are not mistaken for real changes in snow depth. It is therefore a diagnostic aid that keeps the snow-depth record trustworthy through the long alpine winter, rather than an environmental quantity in itself.
WS100_AbsPrecip
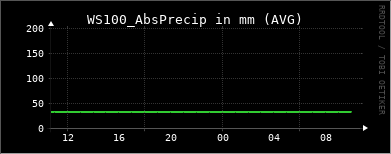
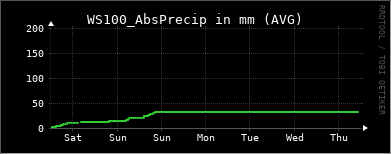
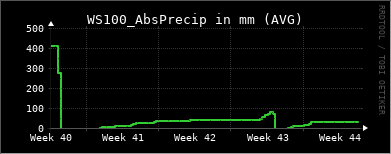
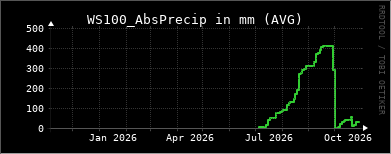
This is the accumulated precipitation measured by the Lufft WS100 radar sensor. The WS100 watches falling drops and flakes with a small Doppler radar and adds up the water they deliver, without a funnel or collector that could be blocked by snow or emptied by evaporation. It was added to the station precisely because much of Macun's precipitation falls as snow, which the impact rain gauge under-catches; the radar captures these winter events far more reliably. Comparing this total with the ATMOS 41 gauge shows how large that snow contribution is and gives a truer figure for the total water reaching the Macun basin over the season.
WS100_Intensity
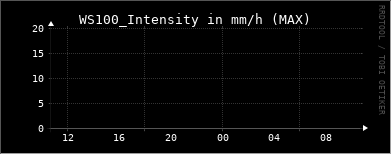
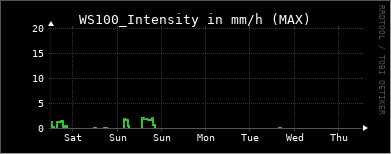
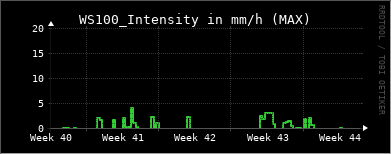
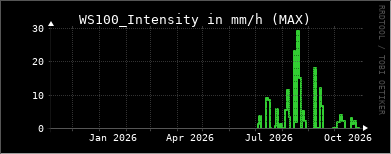
This is the precipitation intensity - the rate at which rain or snow is currently falling - reported by the Lufft WS100 radar sensor. Where the accumulated value tells you how much has fallen in total, the intensity tells you how hard it is coming down at any moment, distinguishing a light drizzle or gentle snowfall from a heavy summer downpour. Sharp peaks in intensity mark the convective thunderstorms that build over the mountains on summer afternoons and often line up with spikes in the lightning and gust records. High rainfall intensities are also what drive rapid runoff and erosion in the steep terrain around the basin.
WS100_Type
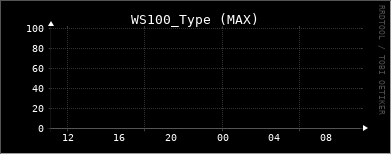
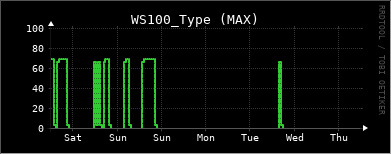
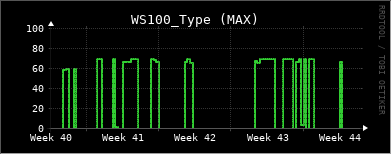
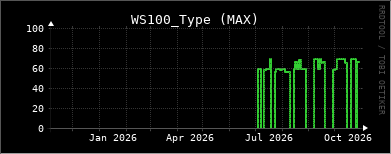
The Lufft WS100 not only measures how much precipitation falls but also classifies its type - for example none, drizzle, rain, sleet, snow or hail - from the size and fall speed of the particles it detects. At 2600 m the phase of precipitation is a key piece of information: whether an event falls as rain or as snow decides whether the water runs off immediately or is stored in the snowpack for release later in the year. Tracking the precipitation type through the seasons shows how the balance between rain and snow shifts, and the rain-snow transition is one of the clearest local fingerprints of a warming alpine climate.